
Here’s the fastest way to stop guessing what a “good LinkedIn ad” means: analyze LinkedIn Ads with Claude Code to find patterns in the top-performing single image ads (by CTRs). I did it because I wanted to know *exactly* why some LinkedIn ads I’ve been running have performed so well in terms of driving clicks to the landing pages, split by CTR levels (and a proxy for “engagement”). Problem was…I had 2,828 image ads 😅 (mixed with TLAs, to boot) There was no way I could analyze them manually. Just opening each of the ads would have taken me 3 hours…
1. Export your LinkedIn Ads performance report e.g. for this year as CSV, filtering for “image ads” only.
2. Upload the file. Ask it to find all the ads which don’t have any value in the “Creative Name”/”DSC Name” columns – these are your TLAs. Split them out.
3. The export file doesn’t have the ad URLs. For Claude to analyze the ads, you’ll need to feed it jpg files. I figured I will need to download them from the Linkedin ads library, but again – no dice I’m manually downloading 2000+ images. I tried GPT agent mode, it did the job for 17 images, and then kept failing (first time I run crying…) My husband advised me to ask Claude to write a Python script for downloading the images from LinkedIn Ads library. Since each ad is basically on “https://www.linkedin[.]com/ad-library/detail/” + AD id, I asked it to find the “Ad ID” column in the export, and add it to the ads library URL as a separate column.
4. I asked Claude Code to write the script to export images from a URL. It gave me instructions on how to deploy it, I freaked out, run to my husband again, who simply told me “just ask it to deploy it”.
5. I then asked it to create folders for the ads with certain CTR brackets (above the median for my whole data set, which I already knew from a gpt project.)
6. I pasted the first batch of ads URLs…and…initially Claude downloaded the advertisers’ logos instead…🫠 I inspected the ad images, and asked it to only include the image with “ad_preview” class. It successfully exported all the ads.
7. I repeated this for all CTR brackets, and then asked it to analyze the images with this prompt: “Analyse the image ads from the “extremely_high_above+median” folder. Analyze them visually to give me points in common & % of top performing unique ads containing the common points, e.g.: – meme – photo of a person – screenshot of an interface – a specific offer – a specific CTA – testimonial/quote – anything else.
Sounds interesting? 😉 Let’s dig into the proper step-by-step instructions!
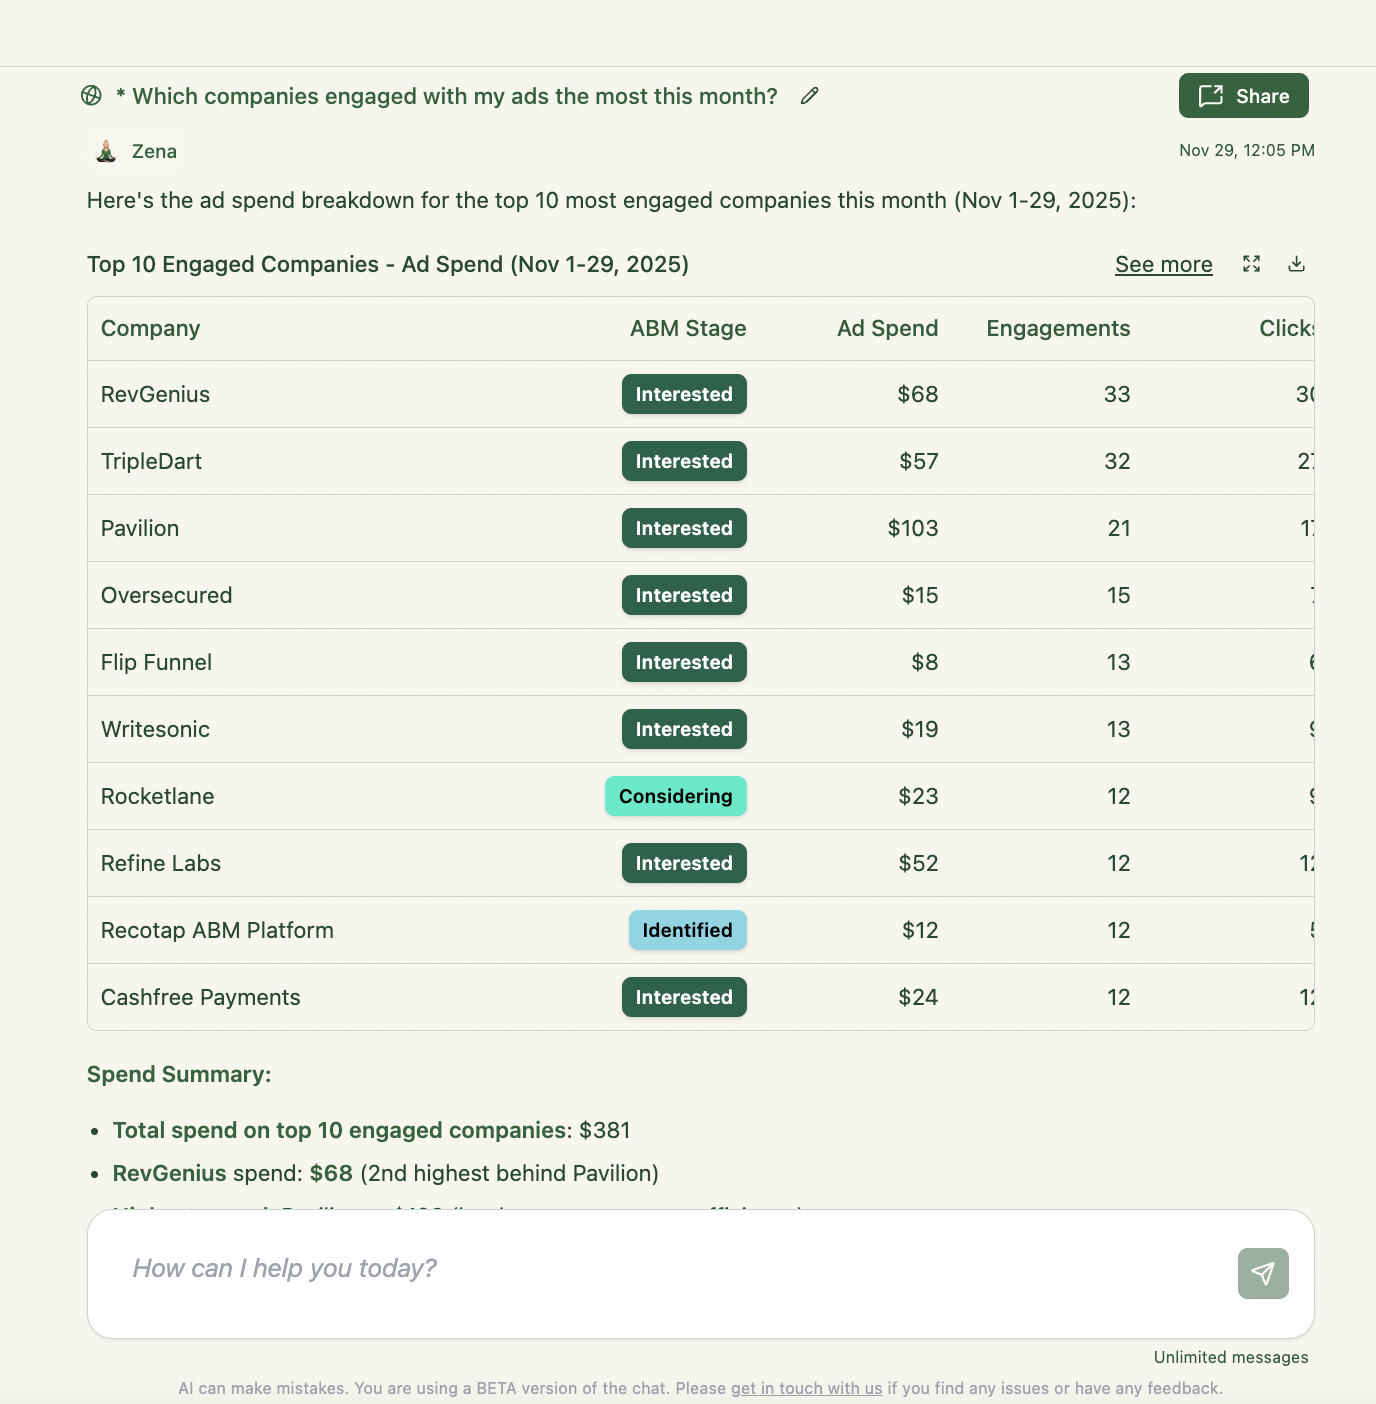
Also – never heard of ZenABM? It de-anonymizes your LinkedIn ads engagements on company level, synchs the engagements with your CRM, combines the singals from your ads with your CRM data to do account scoring & give you company-level intent signals, and helps you draw conclusions with AI:
![]()

Want to get a report linke this? 😉 Here’s how to do it:

This step-by-step workflow shows you how to run a qualitative analysis of LinkedIn ads using Claude Code – by downloading your ad creatives from the LinkedIn Ad Library, organizing them by CTR performance tiers, and generating an insight report that tells you exactly what your top performers do differently.
If you’re doing ABM, this is especially powerful because creative is the lever you pull most often (and the one you usually “vibe” your way through). This process gives you a repeatable, semi-automated LinkedIn ad creative audit you can run quarterly.
What’s next: we’re bringing this exact workflow into ZenABM soon—so instead of exporting CSVs and running scripts, you’ll be able to do qualitative + quantitative creative analysis inside ZenABM in a couple clicks.
And yes: Zena AI (ZenABM’s AI analyst) will be able to analyze your LinkedIn ads both quantitatively (CTR, spend, CPC, CPM, conversion metrics, pipeline influence) and qualitatively (visual patterns, CTA treatments, offer types, layouts, readability, proof elements).

Until that’s fully productized, here’s the current best-practice way to do it with Claude Code.

Most “creative analysis” meetings end with: “I think people ads work” or “maybe we need brighter colors.” 😅
A proper qualitative LinkedIn ads analysis gives you:
Disclaimer: I know, I know – CTR is not the finish line for LinkedIn ABM ads. It’s a useful proxy. The real question is: “Did this creative move target accounts forward?”
Btw. ZenABM helps you connect creatives to account engagement and pipeline influence (aka: the stuff your CFO cares about).
If you want to skip the manual work soon: this qualitative audit flow is being built into ZenABM, and Zena AI will be the layer that summarizes both your performance metrics and your creative patterns into one recommendation report.
In LinkedIn Campaign Manager, export ad performance to CSV/Excel. It will export impressions, clicks, and spend – then you can layer in cost-efficiency (e.g., CTR vs CPC vs CPM).

The crux of the issue is that LinkedIn’s Campaign Manager “Performance Report” export doesn’t give you the ad image file links – you can find them in the LinkedIn Ads Library. But it does give you the Ad ID, and every public Ad Library page follows the same pattern: https://www.linkedin.com/ad-library/detail/ + Ad ID.
So once you’ve filtered your export to image ads and split out TLAs (the rows with no “Creative Name” / “DSC Name”), you can create a new column like “LinkedIn Ad Library URL” and populate it by concatenating that base URL with the value from the Ad ID column for each row. Example: if Ad ID = 280756436, your URL becomes https://www.linkedin.com/ad-library/detail/280756436. That one simple column turns a dead CSV into an automation-friendly input: you can bucket URLs by CTR tier, paste each bucket into Claude Code, and have it download creatives at scale (instead of you manually saving 2,000 images and losing the will to live).
This is where you avoid bad conclusions. You need distinct brackets so you’re not comparing “slightly above average” to “slightly below average” and calling it insight.
Example CTR brackets (adjust to your average/median CTR – I took mine from an earlier analysis):
Create one text file per bracket (one URL per line). Use descriptive filenames:
linkedin_ad_urls_extremely_high.txtlinkedin_ad_urls_very_high.txtlinkedin_ad_urls_low.txtPro tip: Don’t mix formats. Run separate audits for Single Image vs Thought Leader Ads (TLAs) vs Document Ads, etc. Otherwise your “patterns” will just be “document ads contain documents.”
This is the “save my eyeballs” step.
For each CTR bracket, give Claude Code:
Example prompt:
Download the ad images (only, no logos) from the URLs in
'linkedin_ad_urls_extremely_high.txt' and put them in the
'extremely_high_above_median - 2.00%+' folder.

Repeat for each ad CTR bracket.
Now ask Claude Code to analyze the “Extremely High” tier first. You’re looking for repeatable visual elements – things you can deliberately reuse.
Example prompt:
“Analyse the image ads from the “extremely_high_above+median – 2.00%+” folder. Analyze them visually to give me points in common and % of top performing unique ads that contain these common points, e.g.:
– meme
– photo of a person
– screenshot of an interface
– a specific offer
– a specific CTA
– testimonial / quote
– anything else.”
What Claude should analyze (the useful stuff):

This is the kind of
It’s not enough to analyze the winners – the biggest “aha” moments come from comparing the pattern in the highest CTR LinkedIn ads to the “loosers” (low CTR ads). This is why I exported images for both.
Example prompt you can use:
Compare the visual patterns between 'extremely_high_above_median' and
'low_above_median' folders. What do top performers do differently?
Look for:
Now the best part – you can ask Claude Code to turn your LinkedIn ads analysis analysis into a simple, actionable “winner ruleset.” Ask Claude to summarize patterns with percentages and recommendations. Also ask it to be concise or give it a work limit – it sometimes gives you a whole bible (I’ve learned the hard way)
Example prompt:
Create a summary report of visual patterns that correlate with high CTR
in my LinkedIn ads. Include specific percentages and actionable recommendations.
Your output should include:
Coming soon in ZenABM: instead of generating this report manually, you’ll be able to run this analysis inside ZenABM—and Zena AI will generate a combined quant + qual summary of LinkedIn ad performance (metrics + creative patterns) that you can use as your creative brief for the next sprint.
Want to close the loop on pipeline today? Use ZenABM to connect which creatives drove engagement from your target accounts and influenced opportunities. Start a free trial or book a demo.
This is the summary of my single image LinkedIn ads analysis done by Claude Code – there was a *long* version too, but it was too long + included identifiable information – so I won’t paste it here. But you must admit this LinkedIn ads analysis done by Claude is *impressive*:
| Visual Element | Extremely High (≥2.00%) | Very High (1.10-2.00%) | High (0.81-1.00%) | Mid (0.55-0.80%) | Low (0.42-0.55%) | LOW (<median) |
| Photo of Real Person(s) | 47% | 35% | 30% | 20% | 25% | 30% |
| Meme/Humorous Image | 35% | 20% | 23% | 10% | 5% | 2% |
| Screenshot of Software/Interface | 35% | 40% | 35% | 50% | 45% | 55% |
| Chart/Diagram/Data Viz | 41% | 45% | 40% | 45% | 35% | 40% |
| Specific Offer (FREE, discount, limited time) | 65% | 40% | 30% | 20% | 15% | 10% |
| Strong CTA Button | 59% | 45% | 35% | 30% | 25% | 20% |
| Testimonial/Quote | 29% | 25% | 20% | 15% | 18% | 20% |
| Stock Photography | 12% | 15% | 18% | 25% | 30% | 35% |
| Minimalist Design | 18% | 25% | 30% | 35% | 40% | 45% |
| Text-Heavy | 12% | 15% | 20% | 30% | 35% | 40% |
| Logo-Centric | 6% | 8% | 10% | 15% | 20% | 25% |

ZenABM & XYZ appear in BOTH top and bottom performers! High Performers:
Low Performers:
Lesson: Creative execution matters more than brand strength.
This is what I found about high performing LinkedIn Ads based on 2800+ ads from 6 companies I analysed:
And low performers tend to have:
Typically 30–60 minutes total: 15–20 minutes to export + bucket URLs, a few minutes to download creatives, and 10–20 minutes to generate and review the pattern report.
Because qualitative analysis only works when you compare like with like. Brackets help you isolate what winners consistently do differently versus underperformers.
Be stricter in your prompt: “Download ad images only (not logos).” Also include the CTR bracket in the folder name so you can rerun cleanly.
Yes—this workflow will soon be available directly inside ZenABM. And Zena AI will analyze LinkedIn ad performance using both quantitative data (CTR, spend, CPC, CPM, pipeline influence) and qualitative data (visual patterns, CTA styles, offer types, layouts).